
“What retention rate proves that we have product–market fit?”
It is one of the most common questions I hear from subscription leaders—and one of the hardest to answer responsibly.
The honest answer is: it depends.
A subscription with a unique business-related ROI could reasonably retain customers in the 90% range. Customers are likely to stay
Netflix, as a discretionary entertainment source, has more competition. Switching costs are low, substitutes are plentiful and retention may be considerably lower—even when customers genuinely like the product.
But that does not mean benchmarks are useless.
Just be thoughtful.
Two Kinds of Benchmarks
The first kind helps you run the business.
These are often internal benchmarks:
-
How does this cohort compare with the one we acquired six months ago?
-
What features drive engagement and renewal?
-
Does retention vary by channel, plan, or use case?
-
Do cancellations spike seasonally?
-
Did a pricing, onboarding, or product change improve customer behavior?
For example, people who sign up for budgeting software as a New Year’s resolution might cancel more quickly than people who sign up randomly.
These metrics often provide early warning signals that something isn’t going well or deeper reasons why some features or messages work better than others. They are more granular, too.
Other metrics, often lagging ones, explain the business to outsiders.
Leadership teams, boards, and investors need a manageable set of indicators they can use to evaluate progress. The strategic question becomes:
What metrics do we want important stakeholders to use when judging whether this subscription is getting stronger?
You need internal and external metrics.
Product–Market Fit Is a System, Not a Metric
For a subscription business, I look for evidence across four categories.
1. Engagement and value
Are customers experiencing the value they expected?
Important measures include:
-
Activation at a meaningful milestone
-
Time to meaningful value
-
Recency and frequency of use
-
Depth and breadth of engagement
The activation milestone should represent customer value—not simply completion of an onboarding step.
Opening an app is an activity. Completing the first workout, publishing the first project or using a feature that solves the customer’s problem may be activation.
2. Retention
Do customers continue choosing the product?
Track:
-
Customer retention
-
Revenue retention
-
Renewal by plan
-
Cohort retention curves
-
Retention by acquisition channel and customer segment
Averages can conceal more than they reveal. A business can show acceptable overall retention while newer cohorts deteriorate—or while one acquisition channel brings in customers who leave almost immediately.
3. Commitment
Are customers demonstrating that the subscription deserves an ongoing place in their lives?
Signals include:
-
Organic and referral-driven acquisition
-
Annual plan selection
-
Expansion into higher tiers or additional users
-
Willingness to accept a price increase
-
Advocacy and recommendations
These behaviors matter because they demonstrate more than satisfaction. They show trust in the Forever Promise: the customer believes the company will continue delivering value into the future.
4. Unit economics
Can the company acquire and serve subscribers economically?
Track:
-
Customer acquisition cost
-
Customer lifetime value
-
CAC payback
-
Gross margin
-
Contribution margin by cohort
An LTV-to-CAC ratio of approximately 3:1 is often treated as a healthy benchmark. But it is not a goal in isolation.
A company that becomes overly protective of the ratio may underinvest in growth. Sometimes a lower short-term ratio is rational if the company has a credible opportunity to acquire valuable customers at scale.
Unit economics should create decision-making discipline—not become an excuse for timidity.
The Numbers That Would Get My Attention
Thanks for reading this far. Here are some benchmarks that would indicate the directional health of a new subscription. They would make me look more closely at a consumer or creator subscription. But a lot would depend on the business and industry—not just these numbers in a vacuum. Please don’t quote me on these without a caveat!
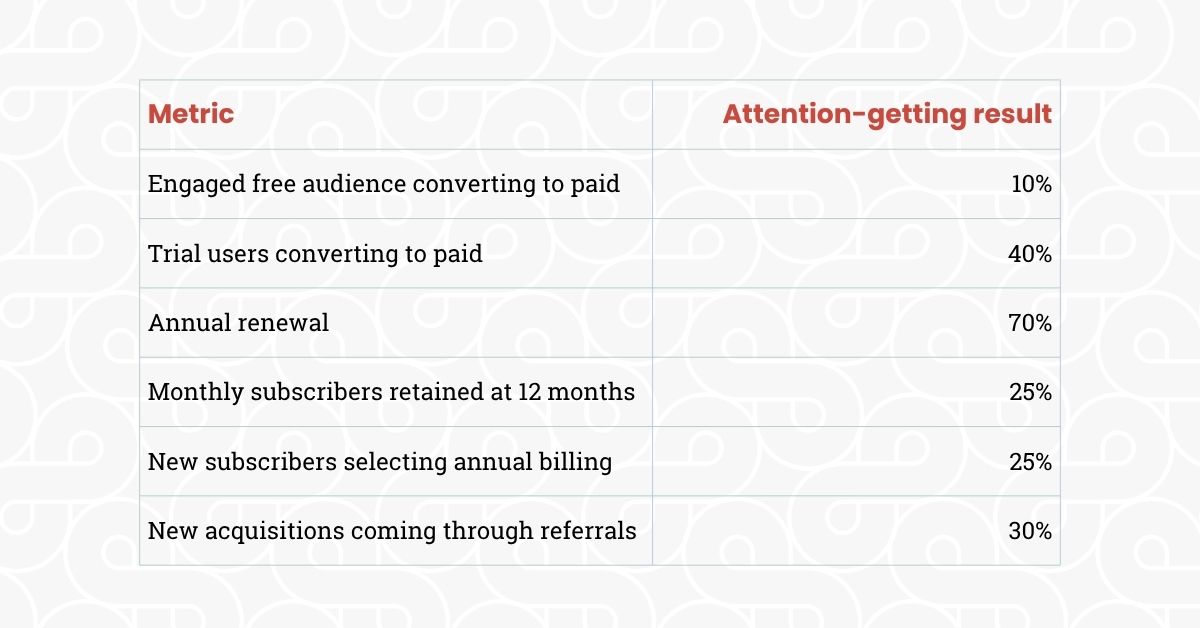
Some of these targets are ambitious.
Substack says paid publications commonly convert approximately 5–10% of free subscribers, with 10% as a goal. RevenueCat’s app-subscription research shows that trial conversion varies substantially by trial length and category, with longer trials producing median conversion rates above 40% in its 2026 data.
Annual commitment is also particularly revealing. Patreon reports that annual members retain at approximately twice the rate of monthly members. RevenueCat similarly finds that annual subscribers are considerably more likely than monthly subscribers to remain active over a full year.
But context still matters.
A 25% annual-plan adoption rate might be highly impressive for a new creator asking an audience to trust an unproven promise. It might be disappointing for a tax-compliance tool that customers expect to use continuously.
A 40% trial conversion rate might signal excellent value realization. It might also result from offering trials only to a small, highly qualified population.
The number is the beginning of the analysis—not the end.
A Note About Involuntary Churn
Not every lost subscriber actively decided to leave.
Payments fail because cards expire, accounts change, banks decline transactions or billing systems fail to recover the payment. Recurly’s benchmark research attributes roughly 1.4% in monthly churn to involuntary causes across its dataset.
That may appear small, but its cumulative impact is material—and unlike dissatisfaction-driven churn, much of it may be recoverable.
Subscription leaders should separately track:
-
Voluntary cancellation
-
Payment failure
-
Recovery rate
-
Retry effectiveness
-
Card-update success
-
Subscriber reactivation
A company that combines voluntary and involuntary churn into a single number loses the ability to diagnose the underlying problem.
Look at What Strong Subscription Companies Choose to Reveal
No public company shares its complete product–market-fit dashboard. But the metrics companies choose to disclose tell you how they want the market to understand their model.
Costco keeps the story remarkably simple: membership growth, renewal, and willingness to pay. The company’s periodic fee increases provide a powerful test of whether members believe the value significantly exceeds the price.
Duolingo reports monthly active users, daily active users, paid subscribers, and revenue. It also increasingly connects specific product experiences to engagement and learning outcomes. The message is clear: habit drives value, and value drives conversion.
Netflix helped establish engagement and retention as core subscription concepts, although it now reveals less subscriber detail than it once did.
For B2B and multiperson subscriptions, HubSpot, Atlassian, and Zoom provide useful examples of tracking revenue retention and expansion across an organization.
These companies are not necessarily giving outsiders every metric that matters. They are selecting a few metrics that reinforce the strategic story they want investors to believe.
Every subscription business should do the same.
Build a Dashboard But Look Past It Too
A high-level dashboard might include the following:
- Activation and time to value
- Engagement with the core behavior
- Cohort retention
- Annual plan adoption
- Organic and referral-driven acquisition
- Unit economics
But you can’t improve every metric simultaneously.
There may be a season of focus on usage, when the priority is helping customers establish habits.
There may be a season of focus on organic growth, when the priority is creating advocacy and referrals.
There may be a season of focus on involuntary churn, when the fastest path to growth is simply recovering customers who never intended to leave.
The goal is not to collect the greatest possible number of metrics. It’s to identify the behaviors that demonstrate customers are receiving ongoing value—and then build the organization around strengthening those behaviors.